Results and Discussions:
Descriptive statistics of the Quantitative variables:
| Quantitative Variables | No. of Observation, N | Mean | Standard Deviation |
| AGE | 50 | 49.14 | 11.502 |
| BMI | 50 | 26.48 | 3.3383 |
| LVEF | 50 | ||
| QRS Score | 50 | 6.88 | 3.842 |
| Vessel Score | 50 | 1.78 | 0.764 |
| Friesinger Score | 50 | 7.52 | 3.019 |
Frequency Distribution of Qualitative Variables:
SEX
| Frequency | Percent | |
| Male | 44 | 88 |
| Female | 6 | 12 |
| Total | 50 | 100 |
SMOKING
| Frequency | Percent | |
| No | 17 | 34 |
| Yes | 33 | 66 |
| Total | 50 | 100 |
DM
| Frequency | Percent | |
| No | 31 | 62 |
| Yes | 19 | 38 |
| Total | 50 | 100 |
HTN
| Frequency | Percent | |
| No | 24 | 48 |
| Yes | 26 | 52 |
| Total | 50 | 100 |
DYSLIPIDEMIA
| Frequency | Percent | |
| No | 40 | 80 |
| Yes | 10 | 20 |
| Total | 50 | 100 |
F/H of IHD
| Frequency | Percent | |
| No | 43 | 86 |
| Yes | 7 | 14 |
| Total | 50 | 100 |
Site of MI
| Frequency | Percent | |
| Anterior | 27 | 54 |
| Inferior | 23 | 46 |
| Total | 50 | 100 |
Relationship of Demographic Variables with QRS score:
The bivariate correlation analysis of Age with QRS score shows that (r=+0.075, p-value=0.606) , which implies that there is a very week positive relationship between those variables and the p-value suggests that the degree of relationship isn’t significant enough.
Again bivariate correlation analysis of BMI with QRS score shows that (r=+0.613, p-value=0.00), which implies that there is a very strong positive relationship between those variables and the p-value suggests that the degree of relationship is highly significant.
Relationship of different groups of SEX with QRS score (ANOVA):
| SEX |
P-Value |
||
| MALE | FEMALE | ||
| QRS Score | 7.30 ± 3.837 | 3.83 ± 2.317 | 0.037 |
There is significant difference in QRS score between Male and Female group of patients (F=4.603, P= 0.037).
ANOVA of QRS Score Among Different Groups of Cardiovascular Risk Factors:
#Data are analyzed using ANOVA statistics and are presented as mean ± SD;
| SMOKING |
P-Value |
||
| NO | YES | ||
| QRS Score | 5.24 ± 3.345 | 7.73 ± 3.851 | 0.028(sig.) |
There is significant difference in QRS score between Smoker and Non-smoker group of patients (F=5.117, P= 0.028).
| DM |
P-Value |
||
| NO | YES | ||
| QRS Score | 6.42 ± 4.023 | 7.63 ± 3.499 | 0.283 |
There is no significant difference in QRS score between two groups of patients who have DM and who don’t have DM (F=1.177, P= 0.283).
| HTN |
P-Value |
||
| NO | YES | ||
| QRS Score | 6.79 ± 3.635 | 6.96 ± 4.094 | 0.878 |
There is no significant difference in QRS score between two groups of patients who have HTN and who don’t have HTN (F=0.024, P= 0.878).
| DYSLIPIDEMIA
|
P-Value |
||
| NO | YES | ||
| QRS Score | 6.63 ± 3.691 | 7.90 ± 4.458 | 0.353 |
There is no significant difference in QRS score between two groups of patients who have DYSLIPIDEMIA and who don’t have (F=0.879, P= 0.353).
| F/H of IHD |
P-Value |
||
| NO | YES | ||
| QRS Score | 6.81 ± 3.614 | 7.29 ± 5.376 | 0.767 |
There is no significant difference in QRS score between two groups of patients who have F/H of IHD and who don’t have (F=0.089, P= 0.767).
ANOVA of QRS Score between Two Groups of Site of MI:
| SITE of MI |
P-Value |
||
| Anterior | Inferior | ||
| QRS Score | 7.11 ± 4.182 | 6.61 ± 3.474 | 0.650 |
There is no significant difference in QRS score between Anterior and Inferior SITE of MI patients (F=0.209, P= 0.650).
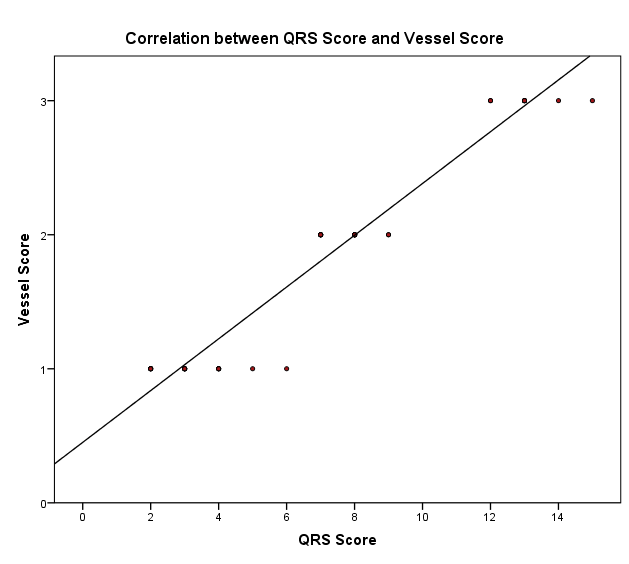
Correlation between QRS Score and Vessel Score:
QRS score and Vessel score exhibits a significantly positive correlation (r=+0.972, p=0.000).Which concludes that QRS score and Vessel score tend to increase and decrease in the same direction.
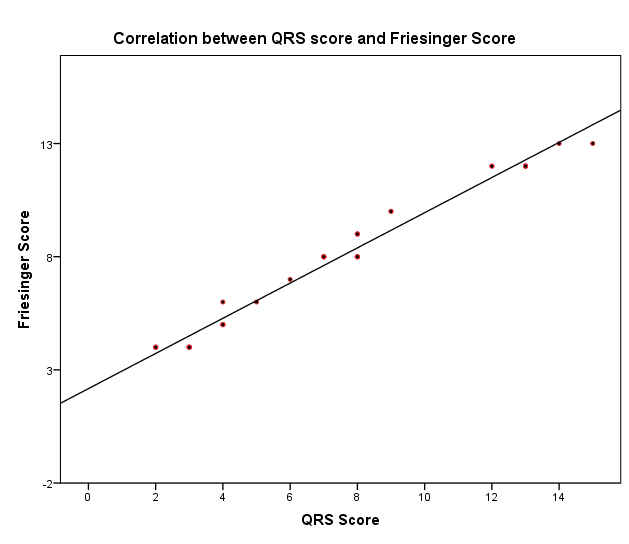
Correlation between QRS Score and Friesinger Score:
QRS score and Friesinger score exhibits a significantly positive correlation (r=+0.989, p=0.000).Which concludes that QRS score and Vessel score tend to increase and decrease in the same direction.
Regression Analysis of QRS score on Vessel score:
A simple regression analysis of QRS score has been performed on Vessel score which yields the following results:
Coefficients:
Model Summary:
| R | R square | Adjusted R square |
| 0.972 | 0.944 | 0.940 |
Which implies that the fitted regression model explains 94% of the total variation of Vessel score by QRS score.
The slope coefficient ẞ=0.193 implies that for per unit change in QRS score, the average probable change in Vessel score will be 0.193 unit.
Regression Analysis of QRS score on Friesinger score:
A simple regression analysis of QRS score has been performed on Friesinger score which yields the following results:
Coefficients:
Model Summary:
| R | R square | Adjusted R square |
| 0.989 | 0.978 | 0.978 |
Which implies that the fitted regression model explains 97.8% of the total variation of Vessel score by QRS score.
The slope coefficient ẞ=0.777 implies that for per unit change in QRS score, the average probable change in Vessel score will be 0.777 unit.
Conclusion:
In this cross sectional observational study, the association between QRS score with angiographic severity was studied through correlation and simple linear regression analysis. Also the mean difference among different groups of cardiovascular risk factors were studied through ANOVA (Analysis of Variance). Demographic characteristics were studied through descriptive analysis and also relationship of demographic variables with QRS score is studied through correlation analysis and ANOVA.
Descriptive analysis of the Quantitative variables reveals that the mean Age of 50 patients were 49.14 ± 11.502; the average BMI of the patients were 26.48 ± 2.2283; the mean LVEF was
; the mean QRS score was 6.88 ± 3.842; the mean Vessel score was 1.78 ± 0.764 and the mean Friesinger score was 7.52 ± 3.019.
Bivariate correlation analysis and ANOVA was performed to study the relationship of demographic variables with QRS score. Correlation analysis reveals that there is no significant relationship between Age and QRS score, but there is a strong positive relationship between BMI and QRS score which is highly significant.
Analysis of Variance (ANOVA) suggests that there is a significant difference in QRS score between male and female group of patients.
Frequency distribution of Qualitative variables shows that 88% of the patients were male and 12% were female; 66% of the patients have the habit of smoking; 38% patients have DM; 52% patients have Dyslipidemia; only 14% patients have F/H of IHD; 54% patients have Anterior site of MI and 46% of the patients have Inferior site of MI.
Analysis of Variance (ANOVA) shows that there is significant difference in QRS score only between smoker and non-smoker group of patients, where there is no significant difference among other groups of cardiovascular risk factors. Also there is no significant difference between Anterior site of MI patients and Inferior site of MI patients.
To study the association between QRS score with angiographic severity we measure the correlation between QRS score and Vessel score, again the correlation between QRS score and Friesinger score. The correlation between QRS score and Vessel score (r= +0.972) indicates a significantly positive correlation between those scores, I.e, they tend to increase or decrease together. Similarly, the correlation between QRS score and Friesinger score (r=+0.989) indicates a significantly positive correlation between them, i.e, they tend to increase or decrease together.
To see the degree of dependence of angiographic severity on QRS score we fit two simple linear regression model- i) regression model of QRS score on Vessel score ii) regression model of QRS score on Friesinger score. The slope coefficient,ẞ=0.193 (p=0.00) of model(i) implies that for per unit change in QRS score, the average probable change in Vessel score will be 0.193 unit. And the slope coefficient,ẞ=0.777 (p=0.00) of model(ii) implies that for per unit change in QRS score, the average probable change in Vessel score will be 0.777 unit. Thus the angiographic severity is significantly dependent on QRS score.
